Beyond the Bling: Using numbers to tell a new story
Jun 5, 2019
Category: PR strategy
Services: Community Relations and Grassroots Advocacy, Strategy and Planning, Visual Storytelling
All too often, we hear PR professionals claim they “don’t do math” or “aren’t good at math.” Can we please stop saying that? Just because math isn’t all that we do, it doesn’t mean that we don’t need or use math to effectively do our jobs. We shouldn’t sell ourselves short.
At Piper & Gold, we are word people, but we are numbers people too. For the month of June, we’re celebrating numbers with our theme #EmbraceNumbers. We recognize and appreciate the insight numbers and statistics offer us.
As one example of that, we’re sharing client work that couldn’t have succeeded without the power of quantitative data: an annual report. Beyond the Bling is a blog series that shares an inside look into our award-winning work, and for this project, we’re spotlighting the Capital Area Michigan Works! 2017 annual report (don’t worry, we’ll share the also-award-winning 2018 annual report in a future post).
Client: Capital Area Michigan Works!
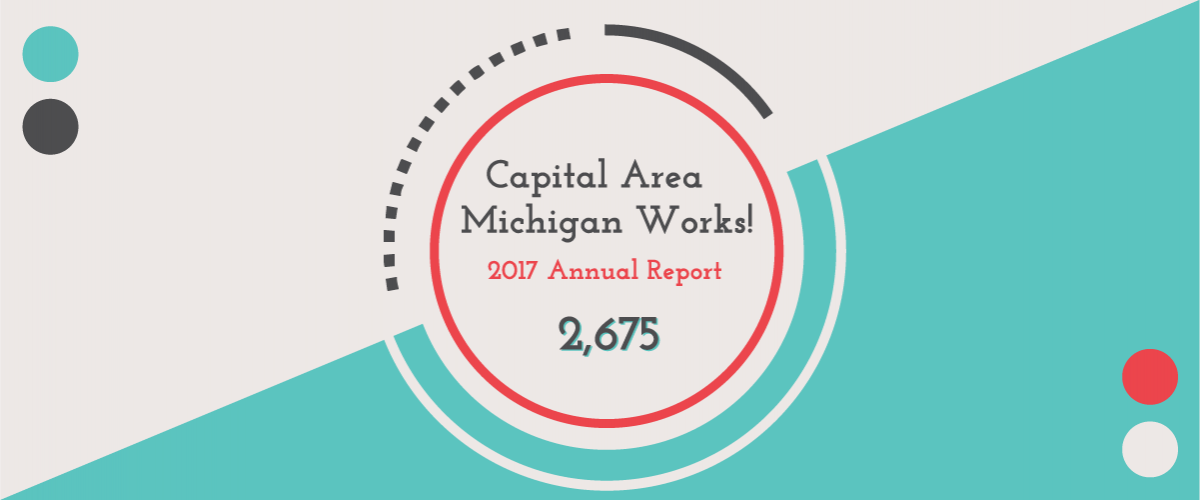
Project: 2017 Annual Report: Connecting with business, strengthening our workforce.
Awards:
- Annual Report Diamond Award, Public Relations Society of America East Central District
- Annual Report Bronze Award, ADDY Award
- Annual Report Honorable Mention, Hermes Award
Snapshot:
There’s something about a new year, season or month that urges us to reflect; and an annual report is just that, a reflection on the past year. And 2017 was a year of massive change for Capital Area Michigan Works! With a drastically different political landscape and new strategic and visual plans, it was critical we emphasize the powerful and important impact CAMW! had in the community.
We needed to also be able to share the numbers behind the agency. Return on investment. Businesses served. Community investment. Mood board concepts presented to the CAMW! team proposed multiple ideas for the annual report, but ultimately, our 2017 annual report took on a “By the Numbers” approach, a dramatic shift from the storytelling style we’d previously used.
Piper & Gold worked collaboratively with CAMW! CEO Edythe Copeland (Hatter-Williams at the time) and her staff to track down the facts and figures behind the work of CAMW! As a government entity, CAMW! collects extensive statistics and data on its programs and participants, so the team spent hours deep within the data to pull out the elements that best told the story of CAMW!’s community impact.
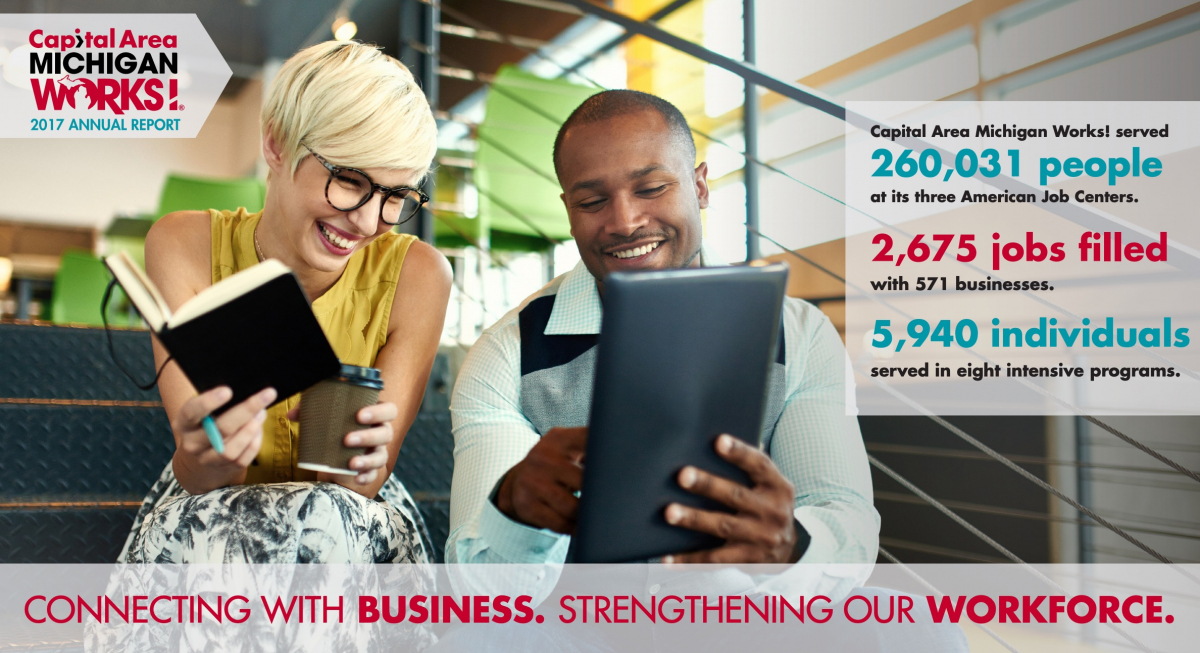
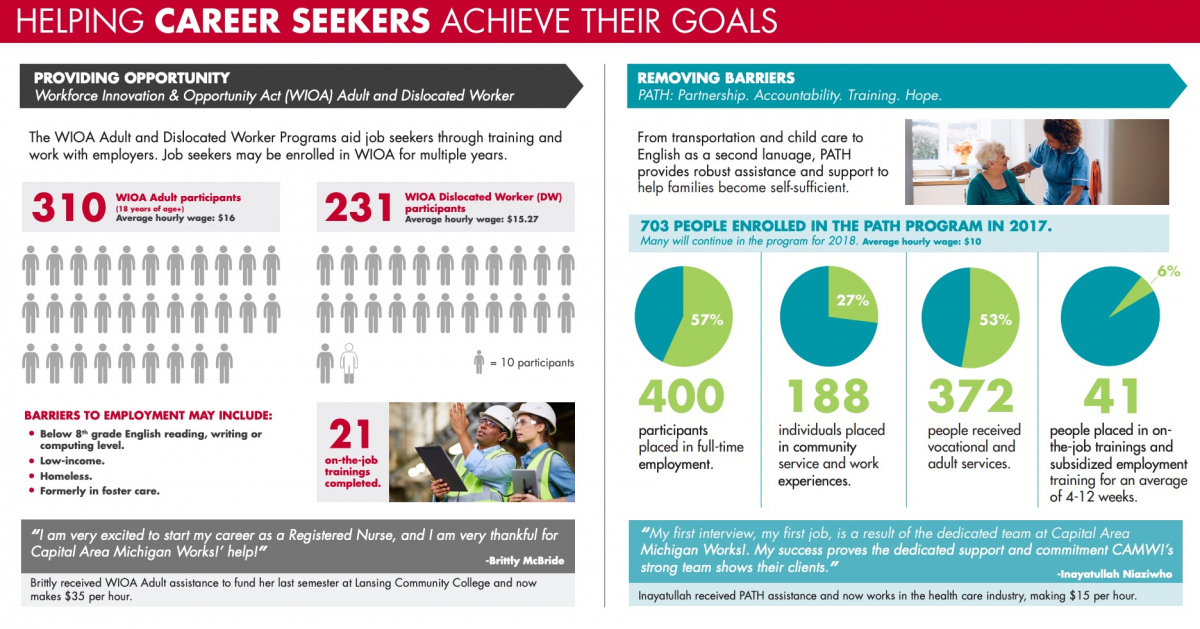
The report put the numbers right on the front, with the design incorporating elements, photography and colors from the new brand. As the reader unfolded the report, they found a full page of statistics interwoven with narrative to help people understand three key areas of impact for CAMW!: services to businesses, services to job seekers and services to youth. The three focal areas were intentionally aligned with the strategic plan goals.
 The 2017 annual report turned out to be much more than numbers. Board members were presented with a copy of the publication at the holiday open house and system celebration, where Copeland highlighted key facts and accomplishments. Additional copies of the annual report were shared with 150 key stakeholders and community leaders, while staff, clients and other community partners could also access the report online.
Ultimately, the 2017 annual report became a part of a toolkit CAMW! uses to help the community understand its mission of connecting with businesses and strengthening our workforce.
Words and numbers don’t have to be so separated from one another. When used together, sentences and statistics can tell a better story than they could have ever told alone.